[Thanks to a reader suggestion, I’ve updated the title and my terminology to ‘south Asia’ to better reflect the regional geography.]
[update 2: corrected the precipitation maps to account for the fact GPM data is provided half-hourly in units of [mm/hr]. Estimated precipitation totals are half of what was originally mapped.]
The scale of the disaster unfolding in the wake of Hurricane Harvey is truly impossible to fathom. Rapid intensification of the storm as it headed towards the Texas coast led to Category 4 hurricane-force winds, and as the center of Harvey stalled out just inland from the Gulf of Mexico some regions received more than 1000 mm of rain in a few days. Some stations are now reporting storm totals over 49″ (1250 mm). The evacuations continue, the reservoirs upstream of Houston are being pumped into the bayous in the hopes of preventing an end-run of storm waters around the back of the dam, and the human toll continues to rise. (update: the reservoirs have overtopped their spillways)
The Global Precipitation Measurement (GPM) mission uses satellites to estimate rainfall rates over most of the globe. These data have already been used elsewhere to examine Harvey, and a short Google Earth Engine script can be used to map preliminary rainfall totals.
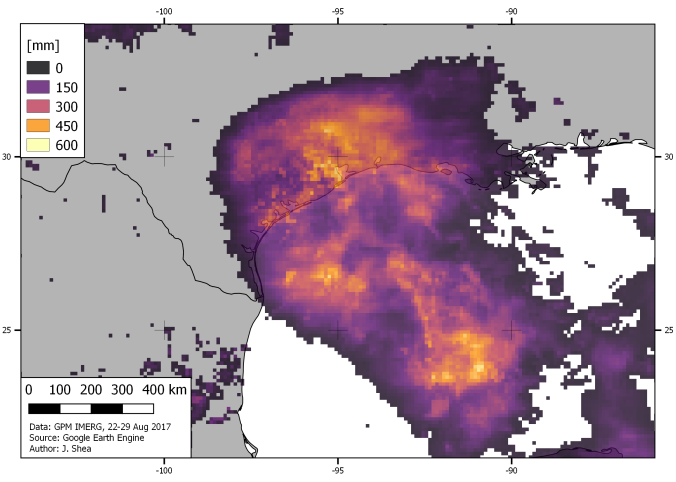
Updated GPM precipitation totals for SE Texas, 22 – 29 August 2017. GPM IMERG data processed in Google Earth Engine and mapped in QGIS
The magnitude of the accumulated rainfall in the Houston area is mind-boggling, but the GPM estimate appears to be about half of what has been observed on the ground. Whats more astounding is that recent rain events in Nepal, India, and Bangladesh are of a similar magnitude and cover an even larger area. You might have missed the events that have taken place in South Asia in the past few weeks, and accurate tallies of the precipitation totals are slow to come out from the region. But the impacts of the floods are being felt by hundreds of millions.
Using Google Earth again, with the same spatial scale and the same colour scale, I mapped the accumulated precipitation between 8 August and 15 August, when the flooding peaked. Total estimated precipitation amounts more than 500 mm cover a large swath of the northern plains, along the borders of Nepal, India, Bangladesh, and Bhutan, with peak precipitation amounts over 1000 mm in Bangladesh.
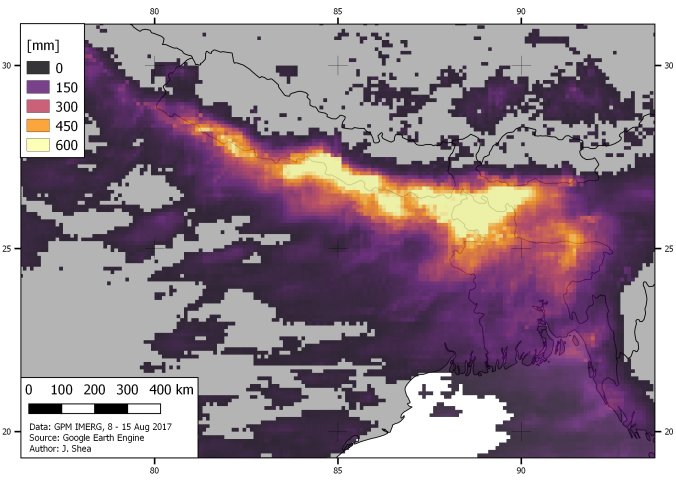
Updated precipitation maps for south Asia, 8 – 15 August 2017. GPM IMERG data processed in Google Earth Engine and plotted in QGIS.
For now, the focus needs to be on the people who are still in trouble or just starting to pick up the pieces. As with most natural disasters, the poorest will be hit the hardest: 80% of those hit by Harvey have no flood insurance, and in thousands of remote villages in SE Asia basic food, water, and sanitation needs are not being addressed.
The role that climate change may or may not have played in both Hurricane Harvey and in the south Asia floods will be examined long after the flood-waters recede. But both events have taken place against the backdrop of a warming atmosphere and warming oceans, and may represent a new reality.
